
Justice Reinvestment Overview
Download original document:
Document text
Document text
This text is machine-read, and may contain errors. Check the original document to verify accuracy.
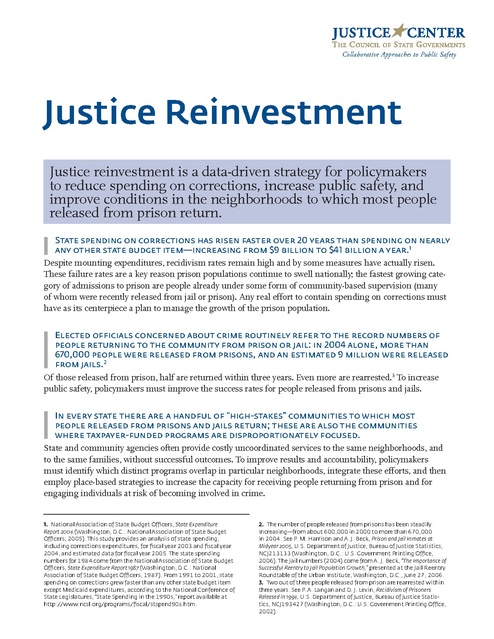
Collaborative Approaches to Public Safety

Justice Reinvestment
Justice reinvestment is a data-driven strategy for policymakers
to reduce spending on corrections, increase public safety, and
improve conditions in the neighborhoods to which most people
released from prison return.
State spending on corrections has risen faster over 20 years than spending on nearly
any other state budget item—increasing from $9 billion to $41 billion a year.1
Despite mounting expenditures, recidivism rates remain high and by some measures have actually risen.
These failure rates are a key reason prison populations continue to swell nationally; the fastest growing category of admissions to prison are people already under some form of community-based supervision (many
of whom were recently released from jail or prison). Any real effort to contain spending on corrections must
have as its centerpiece a plan to manage the growth of the prison population.
Elected officials concerned about crime routinely refer to the record numbers of
people returning to the community from prison or jail: in 2004 alone, more than
670,000 people were released from prisons, and an estimated 9 million were released
from jails.2
Of those released from prison, half are returned within three years. Even more are rearrested.3 To increase
public safety, policymakers must improve the success rates for people released from prisons and jails.
In every state there are a handful of “high-stakes” communities to which most
people released from prisons and jails return; these are also the communities
where taxpayer-funded programs are disproportionately focused.
State and community agencies often provide costly uncoordinated services to the same neighborhoods, and
to the same families, without successful outcomes. To improve results and accountability, policymakers
must identify which distinct programs overlap in particular neighborhoods, integrate these efforts, and then
employ place-based strategies to increase the capacity for receiving people returning from prison and for
engaging individuals at risk of becoming involved in crime.

1. National Association of State Budget Officers, State Expenditure
Report 2004 (Washington, D.C.: National Association of State Budget
Officers, 2005). This study provides an analysis of state spending,
including corrections expenditures, for fiscal year 2003 and fiscal year
2004, and estimated data for fiscal year 2005. The state spending
numbers for 1984 come from the National Association of State Budget
Officers, State Expenditure Report 1987 (Washington, D.C.: National
Association of State Budget Officers, 1987). From 1991 to 2001, state
spending on corrections grew faster than any other state budget item
except Medicaid expenditures, according to the National Conference of
State Legislatures, “State Spending in the 1990s,” report available at
http://www.ncsl.org/programs/fiscal/stspend90s.htm.

2. The number of people released from prisons has been steadily
increasing—from about 600,000 in 2000 to more than 670,000
in 2004. See P. M. Harrison and A. J. Beck, Prison and Jail Inmates at
Midyear 2005, U.S. Department of Justice, Bureau of Justice Statistics,
NCJ213133 (Washington, D.C.: U.S. Government Printing Office,
2006). The jail numbers (2004) come from A. J. Beck, “The Importance of
Successful Reentry to Jail Population Growth,” presented at the Jail Reentry
Roundtable of the Urban Institute, Washington, D.C., June 27, 2006.
3. Two out of three people released from prison are rearrested within
three years. See P. A. Langan and D. J. Levin, Recidivism of Prisoners
Released in 1994, U.S. Department of Justice, Bureau of Justice Statistics, NCJ193427 (Washington, D.C.: U.S. Government Printing Office,
2002).

How Justice Reinvestment Works

1

Analyze the prison population and
spending in the communities to
which people in prison often return.

Justice reinvestment experts review prison admission data to determine what is driving increases
in the population. They calculate the length of
stay for various categories of people incarcerated,
determine when and how people are released
from prison, assess compliance rates for people
under probation and parole supervision, and
identify categories of people particularly likely
to recidivate. Using mapping technology, these
experts provide geographic analyses to pinpoint
which neighborhoods receive people released from
prison. These maps also highlight how spending on
programs—Temporary Assistance to Needy Families (TANF), food stamps, child support, unemployment insurance, housing subsidies, Medicaid, and
others—often converges on the same families and
communities. These data highlight opportunities to
manage the prison population growth, increase the
integration of government programs and funding
streams, and strengthen particular “high-stakes”
neighborhoods.

2

Provide policymakers with options
to generate savings and increase
public safety.

The justice reinvestment experts generate various
options that recognize the uniqueness of each
state’s criminal justice system and tailor them to
that jurisdiction, such as strategies to
• reduce parole and probation revocations,
• focus supervision resources where they can have
the greatest impact, and
• hold offenders (and service providers) accountable for the successful completion of programs
such as drug treatment and job training.
When implemented correctly, these and other
options moderate the growth of a state’s prison
population and make programs more effective and
efficient—results that help policymakers contain
and cut spending. At the same time, using data
to focus resources on those people most likely to
re-offend makes communities safer.

State Spending on Corrections by Year

“We’ve got a broken corrections system. Recidivism rates are too high
and create too much of a financial
burden on states without protecting
public safety. My state and others
are reinventing how we do business
by employing justice reinvestment
strategies that can put our taxpayers’
dollars to better use.” — U.S. Senator
Sam Brownback (R-Kansas)

billions of dollars

50

40

30

20

10
0

1984 ’86
2

Justice Reinvestment: Overview

‘88

‘90

‘92

‘94

‘96

‘98

‘00

‘02

Data Source: National Association of State Budget Officers,
State Expenditures Report, 1985 – 2004

‘04

3

Quantify savings and reinvest in
select high-stakes communities.

State and city leaders work with the justice reinvestment team to determine how much they will save,
and avoid spending, by adopting some or all of the
options identified by the experts. Policymakers and
the team’s experts develop plans for reinvesting a
portion of these savings in new or enhanced initiatives in areas where the majority of people released
from prisons and jails return. For example, officials can reinvest the savings and deploy existing
resources in a high-stakes neighborhood to redevelop abandoned housing and better coordinate
such services as substance abuse and mental health
treatment, job training, and education. Unlike
a prison reentry program, which residents may
perceive negatively as prioritizing limited resources
for people released from prison, these efforts are
viewed generally as benefiting everyone in the
community, regardless of their involvement in the
criminal justice system.

4

Measure the impact and
enhance accountability.

For each policy adopted, an appropriate state agency
is charged with setting performance measures
and projected outcomes, such as the amount of
corrections costs saved or avoided, recidivism
rates, and indicators of community capacity. Policymakers can use these measures to determine
whether agencies are implementing the new policies effectively, assess how closely the actual impact
of these new policies corresponds to projections,
and make any necessary adjustments. The appropriate state agency is also charged with establishing
systems that can span multiple agencies to collect
and analyze data and provide periodic reports to
policymakers. These integrated reports provide a
comprehensive portrait of the effectiveness of state
expenditures to increase public safety and build
stronger neighborhoods.

Overlapping Spending in District 1, Wichita, Kansas

District 1
($11.4m)

State spending on corrections for
offenders from Wichita is approximately $28.9 million. Of that sum,
39 percent ($11.4 million) is spent
on offenders who lived in a single
district—Council District 1. In that
same district, $8.7 million in additional taxpayer dollars is spent on
food stamps, unemployment insurance, and Temporary Assistance to
Families (TAF).

N
E

W
S

Data Sources: Kansas Department of Corrections, “Prison Admissions 01/01/04 – 12/30/04.” Kansas Department of Labor,
“Unemployment Insurance Recipients in December 2004.” Kansas Department of Social and Rehabilitation Services,
“Temporary Assistance to Families Recipients in December 2004” and “Food Stamp Recipients in December 2004.”

Justice Reinvestment: Overview

3

Pursuing a Justice Reinvestment Strategy

The Council of State Governments Justice Center, with support from the U.S. Department of
Justice’s Bureau of Justice Assistance and private grant makers such as The Pew Charitable Trusts,
the JEHT Foundation, and the Open Society Institute, is providing intensive technical assistance
to a limited number of states that demonstrate a bipartisan interest in justice reinvestment.
Policymakers in Connecticut, facing an unprecedented budget deficit and a prison population
growing faster than any other state, were presented
with two options: release people from prison early
or contract with other states for additional prison
beds to relieve crowding. Instead they chose a third
way—a justice reinvestment strategy. With nearly
unanimous support in the legislature, the state
enacted laws that streamlined the parole process for
low-risk offenders, addressed the high rate of probation violations, and developed a comprehensive
strategy to reduce recidivism. Almost $13 million
of the nearly $30 million saved was reinvested in
community-based pilot projects. Probation violations dropped from 400 in July 2003 to 200 in
September 2005. The decrease in the prison population over a two-year period was steeper than that
seen in almost any other state while the crime rate
continued to drop.

In Kansas, violations of parole and probation
accounted for 68 percent of state prison admissions
in 2004; 50 percent of the violations were classified
as drug/alcohol use or failure to report to supervision. The state, as part of a justice reinvestment
strategy started in 2005, is making a concerted effort
to cut these violations in half. If successful, the
initiative could help policymakers avoid spending
millions of dollars on new prison construction and
operating costs. Geographical analyses illustrate that
one-third of people completing their prison terms in
Kansas return to a single county; within that county,
people disproportionately return to one neighborhood. Using some of the anticipated savings, state
and local officials are partnering to reinvest in the
transformation of a neighborhood with numerous
boarded-up houses, high crime rates, and a large
number of prison admissions. The joint effort seeks
to redevelop the neighborhood’s housing stock, integrate and improve the delivery of services to support
strong families, and expand employment opportunities for neighborhood residents (including those
recently released from prison and jail).

“It’s always been safer politically to build the next prison, rather than stop and see
whether that’s really the smartest thing to do. But we’re at a point where I don’t
think we can afford to do that anymore. . . . We have to look for a better solution
to the problem, and that isn’t more new prisons.” — Texas State Senator John
Whitmire (D-Houston), Chairman of the Senate Criminal Justice Committee
Council of State Governments
Justice Center
100 Wall Street,
20th Floor
New York, NY 10005
tel: 212-482-2320
fax: 212-482-2344
4

4630 Montgomery Avenue
Suite 650
Bethesda, MD 20814
tel: 301-760-2401
fax: 240-497-0568

Justice Reinvestment: Overview

project contact:
Crystal Garland
(646) 383-5744
cgarland@csg.org

www.justicecenter.csg.org
www.justicereinvestment.org