
Highlights From 2020-2022 Criminal Summons Data
Download original document:
Document text
Document text
This text is machine-read, and may contain errors. Check the original document to verify accuracy.
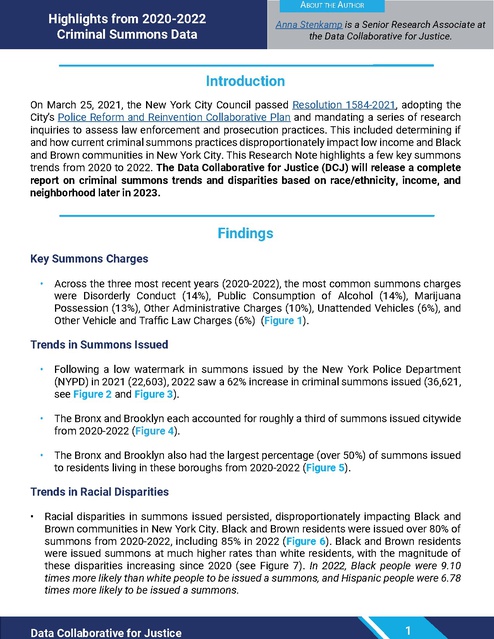
About the Author

Highlights from 2020-2022
Criminal Summons Data

Anna Stenkamp is a Senior Research Associate at
the Data Collaborative for Justice.

Introduction
On March 25, 2021, the New York City Council passed Resolution 1584-2021, adopting the
City’s Police Reform and Reinvention Collaborative Plan and mandating a series of research
inquiries to assess law enforcement and prosecution practices. This included determining if
and how current criminal summons practices disproportionately impact low income and Black
and Brown communities in New York City. This Research Note highlights a few key summons
trends from 2020 to 2022. The Data Collaborative for Justice (DCJ) will release a complete
report on criminal summons trends and disparities based on race/ethnicity, income, and
neighborhood later in 2023.

Findings
Key Summons Charges
•

Across the three most recent years (2020-2022), the most common summons charges
were Disorderly Conduct (14%), Public Consumption of Alcohol (14%), Marijuana
Possession (13%), Other Administrative Charges (10%), Unattended Vehicles (6%), and
Other Vehicle and Traffic Law Charges (6%) (Figure 1).

Trends in Summons Issued
•

Following a low watermark in summons issued by the New York Police Department
(NYPD) in 2021 (22,603), 2022 saw a 62% increase in criminal summons issued (36,621,
see Figure 2 and Figure 3).

•

The Bronx and Brooklyn each accounted for roughly a third of summons issued citywide
from 2020-2022 (Figure 4).

•

The Bronx and Brooklyn also had the largest percentage (over 50%) of summons issued
to residents living in these boroughs from 2020-2022 (Figure 5).

Trends in Racial Disparities
•

Racial disparities in summons issued persisted, disproportionately impacting Black and
Brown communities in New York City. Black and Brown residents were issued over 80% of
summons from 2020-2022, including 85% in 2022 (Figure 6). Black and Brown residents
were issued summons at much higher rates than white residents, with the magnitude of
these disparities increasing since 2020 (see Figure 7). In 2022, Black people were 9.10
times more likely than white people to be issued a summons, and Hispanic people were 6.78
times more likely to be issued a summons.

Data Collaborative for Justice

1

Trends in Racial Disparities and Income
•

Lower income New Yorkers were issued more summons than higher income New Yorkers,
with over 61% of summons issued to those who are below the median household income
of New York City ($70,663) (Figure 9).

•

When analyzing summons issued based on median household income according to the
census, regardless of income, Black and Brown New Yorkers were disproportionately
issued summonses compared to white New Yorkers (Figure 10).
Figure 1.
Top Summons Charges (2020-2022)

Summons Charge
Percent of Total
Disorderly Conduct (PL 240.20)
14%
Public Consumption of Alcohol (AC 10-125) I 14%
Marijuana Possession (PL 221.05)
13%
Other Administrative Code Charges (25 AC) I 10%
Unattended Vehicle (AC 10-111)
6%
Other Vehicle and Traffic Law (62 VTL)
16%
All Other Charaes
37%

Figure 2.
Summons Issued: 2013-2022

400000
350000
Criminal Justice
Reform Act (CJRA)
became law June 2016

300000
250000
200000
150000
100000
50000
0

2013

2014

2015

2016

2017

2018

2019

2020

2021

2022

Note: The CJRA moved many criminal summons cases to the civil justice system.

Data Collaborative for Justice

2

Figure 3.
Summons Issued: 2021-2022
40,000
35,000
30,000

+62%

25,000
20,000
15,000
10,000
5,000
0
2021

2022

Figure 4.
Percentage of Summons Issued by Borough of Issuance, 2020-2022

100%

- · ro-

90%

_ , o.._

17%

80%

19%

70%
60%
50%
40%
30%
20%
10%
0%
2020
■

Bronx

2021
■

Brooklyn

Data Collaborative for Justice

■

Manhattan

2022
■

Queens

■ Staten

Island

3

Figure 5.
Percentage of Summons Issued by Borough of Residence of the Charged Individual,
2020-2022
100%
90%
80%
70%
60%
50%
40%
30%
20%
10%
0%
2020
■ Bronx

■ Brooklyn

2021
■ Manhattan

2022

■ Queens

■ Staten Island

■ Outside of NYC

Figure 6.
Percentage of Summons Issued by Race/Ethnicity, 2020-2022
100%

5%

90%

6%

... .

I''

80%
70%
60%

50%

40%
30%

20%
10%
0%

2020
■

Black

■

Hispanic

2021
■

White

■

Asian

2022
■

Additional Racial/Ethnic Groups

*Note: Additional Racial/Ethnic Groups (green bars) each = 1%.

Data Collaborative for Justice

4

Figure 7.
Higher Rate of Summons Issued for Black and Hispanic People Compared to White People
(Relative to Their General Population Numbers)
12.00
9.83

9.10

10.00
8.00

6.78
6.06

6.00
4.00
2.00
0.00
2020

-

Black/white

2021

-

2022

Hispanic/white

Note: This only includes New York City residents over the age of 18.

Figure 8.
2020 Pandemic-Related Charges vs. All Other Charges by Race and Ethnicity
60%
50%

51%
40%
30%

36...

135%
30-..

20%

2s-..

10%

9%
0%

Black

Hispanic
■

White

Pandemic-Related Charges

Data Collaborative for Justice

I '"

5%7

Asian
■

All Other Charges

1%

1%

Additional
Racial/Ethnic
Groups

5

Figure 9.
Summons Issued by Household Income
45%
40%
35%
30%
25%
20%
15%
10%
5%
0%
$15,000-$34,999 $35,000-$49,999 $50,000-$74,999 $75,000-$99,999
■

2020

■

2021

■

$100,000 +

2022

Figure 10:
2022 Summons Issued by Race/Ethnicity and Income

60%

52%
50%
40%
30%
20%
10%
0%

$15,000-$34,999
■

Black

$35,000-$49,999
■

Hispanic

Data Collaborative for Justice

■

White

$50,000-$74,999
■

Asian

■

$75,000-$99,999

$100,000 +

Additional Racial/Ethnic Groups

6