

Doj Fact Sheet Juvenile Delinquency Probation Caseload 2005
Download original document:
Document text
Document text
This text is machine-read, and may contain errors. Check the original document to verify accuracy.
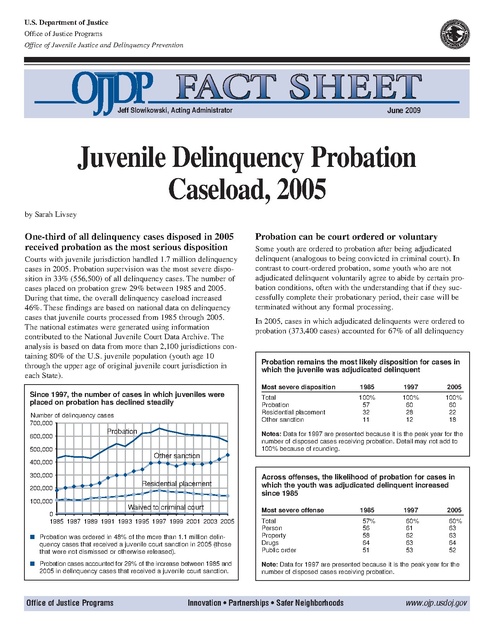
U.S. Department of Justice
Office of Justice Programs
Office of Juvenile Justice and Delinquency Prevention

June 2009

Jeff Slowikowski, Acting Administrator

Juvenile Delinquency Probation

Caseload, 2005

by Sarah Livsey

One-third of all delinquency cases disposed in 2005
received probation as the most serious disposition
Courts with juvenile jurisdiction handled 1.7 million delinquency
cases in 2005. Probation supervision was the most severe disposition in 33% (556,500) of all delinquency cases. The number of
cases placed on probation grew 29% between 1985 and 2005.
During that time, the overall delinquency caseload increased
46%. These findings are based on national data on delinquency
cases that juvenile courts processed from 1985 through 2005.
The national estimates were generated using information
contributed to the National Juvenile Court Data Archive. The
analysis is based on data from more than 2,100 jurisdictions containing 80% of the U.S. juvenile population (youth age 10
through the upper age of original juvenile court jurisdiction in
each State).
Since 1997, the number of cases in which juveniles were
placed on probation has declined steadily
Number of delinquency cases
700,000
600,000

Probation

Probation can be court ordered or voluntary
Some youth are ordered to probation after being adjudicated
delinquent (analogous to being convicted in criminal court). In
contrast to court-ordered probation, some youth who are not
adjudicated delinquent voluntarily agree to abide by certain probation conditions, often with the understanding that if they successfully complete their probationary period, their case will be
terminated without any formal processing.
In 2005, cases in which adjudicated delinquents were ordered to
probation (373,400 cases) accounted for 67% of all delinquency

Probation remains the most likely disposition for cases in
which the juvenile was adjudicated delinquent
Most severe disposition

1985

1997

2005

Total
Probation
Residential placement
Other sanction

100%
57
32
11

100%
60
28
12

100%
60
22
18

Notes: Data for 1997 are presented because it is the peak year for the
number of disposed cases receiving probation. Detail may not add to
100% because of rounding.

500,000

Other sanction
400,000
300,000
200,000
100,000

Residential placement
Waived to criminal court

0
1985 1987 1989 1991 1993 1995 1997 1999 2001 2003 2005

Across offenses, the likelihood of probation for cases in
which the youth was adjudicated delinquent increased
since 1985
Most severe offense

1985

1997

2005

57%
56
58
64
51

60%
61
62
63
53

60%
63
63
64
52

■ Probation was ordered in 48% of the more than 1.1 million delinquency cases that received a juvenile court sanction in 2005 (those
that were not dismissed or otherwise released).

Total
Person
Property
Drugs
Public order

■ Probation cases accounted for 29% of the increase between 1985 and
2005 in delinquency cases that received a juvenile court sanction.

Note: Data for 1997 are presented because it is the peak year for the
number of disposed cases receiving probation.

Office of Justice Programs

Innovation • Partnerships • Safer Neighborhoods

www.ojp.usdoj.gov

cases placed on probation. In the remaining delinquency cases,
the youth agreed to some form of voluntary, or informal, probation. The number of adjudicated cases that resulted in courtordered probation rose 95% between 1985 and 2005 (from
191,500 to 373,400). In comparison, the number of cases that
resulted in informal probation decreased 19% (from 201,700 to
164,000), reflecting the trend toward more formal processing of
delinquency cases.

Most cases placed on probation involve white youth
and males
In 2005, 67% of cases placed on probation involved white juveniles, 30% involved black juveniles, and 3% involved juveniles
of other races. Between 1985 and 2005, the probation caseload
grew 60% for black juveniles (from 104,400 to 167,300) and
17% for white juveniles (from 318,700 to 373,000). Most cases
(74%) placed on probation in 2005 involved males (about
410,200 cases). However, the female share of the probation caseload grew from 18% in 1985 to 26% in 2005. Juveniles ages
14–16 accounted for 64% (about 357,300 cases) of the probation
caseload in 2005.

Property offense cases made up the greatest
proportion of the probation caseload

The offense profile of informal probation cases followed a similar trend. The proportion of informal probation cases that involved property offenses also declined more than 20 percentage
points between 1985 and 2005 (from 67% to 38%). As a result,
the profile of the informal probation caseload also contained
greater proportions of person, drug, and public order offense
cases in 2005 than in 1985.
Offense profile of cases placed on probation
Informal
probation

Most severe offense

1985

2005

1985

2005

Total
Person
Property
Drugs
Public order

100%
17
60
7
16

100%
26
36
13
26

100%
13
67
7
12

100%
21
38
13
29

Note: Detail may not add to 100% because of rounding.

Fact Sheet

Adjudicated cases placed on formal probation
180,000
160,000

Property

140,000
120,000
100,000
80,000
60,000

Person

40,000

Public order
Drugs

20,000

0
1985 1987 1989 1991 1993 1995 1997 1999 2001 2003 2005

The number of person, drug, and public order offense
cases placed on informal probation increased between
1985 and 2005, while property offense cases decreased
more than 50% during that period
Cases placed on informal probation
160,000

The offense profile of the probation caseload has changed somewhat since 1985. Property offense cases continued to account for
the majority of cases placed on probation, but their share of the
probation caseload declined. For example, the proportion of adjudicated cases that involved property offenses and received formal
probation as the most severe disposition declined more than 20
percentage points between 1985 and 2005 (from 60% to 36%).
As a result, the profile of the formal probation caseload contained greater proportions of person, drug, and public order
offense cases in 2005 than in 1985.

Formal
probation

Between 1997 and 2005, the number of adjudicated cases
resulting in probation increased for person, drugs, and
public order offense cases but decreased for property
offense cases

140,000

Property

120,000
100,000
80,000
60,000
40,000

Person

20,000

Public order

Drugs

0
1985 1987 1989 1991 1993 1995 1997 1999 2001 2003 2005

For further information
This Fact Sheet is based on the report Juvenile Court Statistics
2005, which is available through OJJDP’s Web site (www.ojp.
usdoj.gov/ojjdp). To learn more about juvenile court cases, visit
OJJDP’s online Statistical Briefing Book (www.ojjdp.ncjrs.gov/
ojstatbb/index.html) and click on “Juveniles in Court.” OJJDP
also supports Easy Access to Juvenile Court Statistics, a Webbased application that analyzes the data files used for the Juvenile Court Statistics report. This application is available from the
“Data Analysis Tools” section of the Statistical Briefing Book.
Sarah Livsey, Ph.D., a Research Associate with the National Center for
Juvenile Justice, prepared this document as a product of the National
Juvenile Court Data Archive, which is supported by OJJDP grants
2007–JL–FX–0007 and 2007–JL–FX–0022.
The Office of Juvenile Justice and Delinquency Prevention is a component
of the Office of Justice Programs, which also includes the Bureau of Justice
Assistance; the Bureau of Justice Statistics; the Community Capacity
Development Office; the National Institute of Justice; the Office for Victims
of Crime; and the Office of Sex Offender Sentencing, Monitoring,
Apprehending, Registering, and Tracking (SMART).

NCJ 224536