

Doj Fact Sheet Delinquency Cases in Juvenile Court 2005
Download original document:
Document text
Document text
This text is machine-read, and may contain errors. Check the original document to verify accuracy.
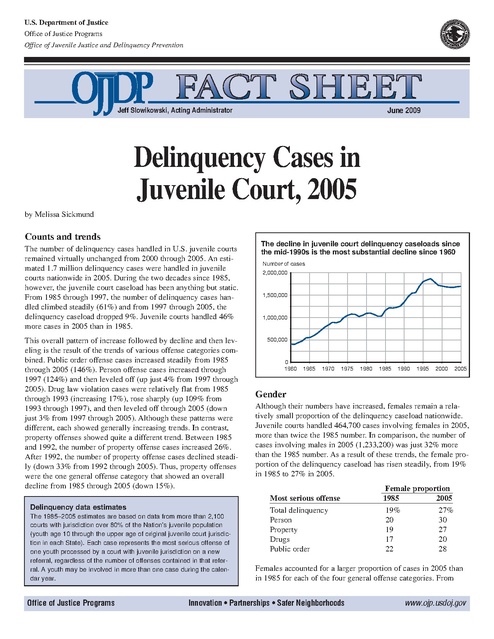
U.S. Department of Justice
Office of Justice Programs
Office of Juvenile Justice and Delinquency Prevention

June 2009

Jeff Slowikowski, Acting Administrator

Delinquency Cases in

Juvenile Court, 2005

by Melissa Sickmund

Counts and trends
The number of delinquency cases handled in U.S. juvenile courts
remained virtually unchanged from 2000 through 2005. An estimated 1.7 million delinquency cases were handled in juvenile
courts nationwide in 2005. During the two decades since 1985,
however, the juvenile court caseload has been anything but static.
From 1985 through 1997, the number of delinquency cases handled climbed steadily (61%) and from 1997 through 2005, the
delinquency caseload dropped 9%. Juvenile courts handled 46%
more cases in 2005 than in 1985.
This overall pattern of increase followed by decline and then leveling is the result of the trends of various offense categories combined. Public order offense cases increased steadily from 1985
through 2005 (146%). Person offense cases increased through
1997 (124%) and then leveled off (up just 4% from 1997 through
2005). Drug law violation cases were relatively flat from 1985
through 1993 (increasing 17%), rose sharply (up 109% from
1993 through 1997), and then leveled off through 2005 (down
just 3% from 1997 through 2005). Although these patterns were
different, each showed generally increasing trends. In contrast,
property offenses showed quite a different trend. Between 1985
and 1992, the number of property offense cases increased 26%.
After 1992, the number of property offense cases declined steadily (down 33% from 1992 through 2005). Thus, property offenses
were the one general offense category that showed an overall
decline from 1985 through 2005 (down 15%).
Delinquency data estimates
The 1985–2005 estimates are based on data from more than 2,100
courts with jurisdiction over 80% of the Nation’s juvenile population
(youth age 10 through the upper age of original juvenile court jurisdiction in each State). Each case represents the most serious offense of
one youth processed by a court with juvenile jurisdiction on a new
referral, regardless of the number of offenses contained in that referral. A youth may be involved in more than one case during the calendar year.

Office of Justice Programs

The decline in juvenile court delinquency caseloads since
the mid-1990s is the most substantial decline since 1960
Number of cases
2,000,000

1,500,000

1,000,000

500,000

0
1960

1965

1970

1975

1980

1985

1990

1995

2000

2005

Gender
Although their numbers have increased, females remain a relatively small proportion of the delinquency caseload nationwide.
Juvenile courts handled 464,700 cases involving females in 2005,
more than twice the 1985 number. In comparison, the number of
cases involving males in 2005 (1,233,200) was just 32% more
than the 1985 number. As a result of these trends, the female proportion of the delinquency caseload has risen steadily, from 19%
in 1985 to 27% in 2005.
Most serious offense
Total delinquency
Person
Property
Drugs
Public order

Female proportion
1985
2005
19%
20
19
17
22

27%
30
27
20
28

Females accounted for a larger proportion of cases in 2005 than
in 1985 for each of the four general offense categories. From

Innovation • Partnerships • Safer Neighborhoods

www.ojp.usdoj.gov

1985 through 2005, female caseloads increased more than male
caseloads for each of the four general offense categories. There
was a large increase in person offense cases for both sexes from
1985 through 2005; however, the relative increase was greater
for cases involving females. Property offense cases involving
females grew from 1985 through 2005, while the number of
cases involving males declined. There was a sharp increase in
drug offense cases involving males during the early 1990s, followed by a leveling off after 1997. However, for females, there
was no leveling off, so their overall increase was relatively
greater. For public order offense cases, both males and females
saw large increases from 1985 through 2005—the caseload more
than doubled for males and more than tripled for females.
Most serious offense
Total delinquency
Person
Property
Drugs
Public order

Percent change, 1985–2005
Female
Male
108%
32%
247
104
24
–24
191
145
221
125

Delinquency cases disposed by most serious offense, 2005
Percent change
Most serious offense
Total delinquency

Number
of cases

1985–
1997

1997–
2005

1985–
2005

1,697,900

61%

–9%

46%

Person offenses
429,500
Criminal homicide
1,400
Forcible rape
4,400
Robbery
26,000
Aggravated assault
49,900
Simple assault
298,600
Other violent sex offenses 17,700
Other person offenses
31,600

124
76
42
39
80
161
72
178

4
–37
–14
–27
–18
13
27
5

133
11
22
2
48
193
118
192

Property offenses
Burglary
Larceny-theft
Motor vehicle theft
Arson
Vandalism
Trespassing
Stolen property offenses
Other property offenses

598,600
97,600
265,800
32,900
8,500
100,900
52,000
19,900
20,900

22
2
23
31
31
36
24
17
74

–30
–34
–35
–36
–8
–13
–22
–38
–32

–15
–32
–20
–16
20
18
–4
–28
17

Drug law violations

195,300

144

3

153

Public order offenses
474,400
Obstruction of justice
222,400
Disorderly conduct
129,600
Weapons offenses
43,600
Liquor law violation
24,600
Nonviolent sex offenses
13,700
Other public order offenses 40,400

111
192
107
125
–16
–1
59

16
16
40
–4
52
10
–17

146
238
191
117
28
8
31

62
18

–21
–34

27
–22

Violent Crime Index*
Property Crime Index**

81,600
404,900

Race
In 2005, white youth accounted for 78% of the U.S. juvenile
population, black youth 17%, Asian youth (including Native
Hawaiian and other Pacific Islander) 4%, and American Indian
youth (including Alaska Native) 1%. Sixty-four percent of delinquency cases handled in 2005 involved white youth, 33% black
youth, 1% Asian youth, and 1% American Indian youth.
Race profile of delinquency cases, 2005
American
Most serious offense Total White Black Indian Asian
Total delinquency
100%
64%
33%
1%
1%
Person
100
57
41
1
1
Property
100
67
29
2
2
Drugs
100
74
24
2
1
Public order
100
63
34
1
1
The racial disparity in delinquency cases varied across offense
categories. White youth accounted for a larger proportion of drug
offense cases (74%) than they did for any of the other three general offense categories. In contrast, white youth were involved in
just 57% of person offense cases. Person offenses had the greatest proportion of cases involving black youth (41%). Asian and
American Indian youth accounted for a very small proportion of
cases across all offense categories.
A comparison of the rate at which cases involving different
groups of youth proceed from one decision point to the next as
they go through the court system shows the unique contributions
made by each decision point to the overall disparity in the system. The rate at which black youth were referred to juvenile
court for a delinquency offense was about 140% greater than the
rate for white youth. The rate at which referred cases were petitioned for formal processing was 18% greater for black youth
than for white youth. The rate at which petitioned cases were
adjudicated was about 9% less for black youth than for white
youth. The rate at which petitioned cases were waived to criminal
court was 10% greater for black youth than the rate for white
youth. The rate at which youth in adjudicated cases were ordered
to residential placement was 24% greater for black youth than for
white youth, but the rate at which they were ordered to probation
was 10% less for black youth than for white youth.

Age
In 2005, juveniles younger than age 16 at the time of referral to
court accounted for 57% of all delinquency cases handled. This
age group accounted for 64% of person offense cases, 59% of
property offense cases, 54% of public order offense cases, and
42% of drug law violation cases.
Person offense cases had the largest proportion of juveniles
younger than age 14 at referral (24%), followed by property
offense cases (20%). There were smaller proportions of cases
involving juveniles younger than age 14 among public order
offense (15%) and drug offense (8%) cases.

Notes: Detail may not add to totals because of rounding. Percent
change calculations are based on unrounded numbers.

Detention

*	 Violent Crime Index includes murder and nonnegligent manslaughter, forcible rape, robbery, and aggravated assault.
** Property Crime Index includes burglary, larceny-theft, motor vehicle
theft, and arson.

A juvenile may be placed in secure detention at various times
during case processing. In general, a juvenile is detained when
there is reason to believe he or she is a threat to the community,
will be at risk if returned to the community, or may fail to appear
—2—

at an upcoming hearing. Intake staff may also detain juveniles for
diagnostic evaluation purposes. All States require that a detention
hearing be held within a few days of admission to detention (usually within 24 hours). At this hearing, the judge reviews the initial detention decision and decides whether to continue the
youth’s detention or to release the youth. The youth may be
detained and released more than once between referral to court
and case disposition. These court data count the number of cases
that involve detention of the juvenile at some point between
referral to court and case disposition. In most delinquency cases,
the juvenile is not detained (79% in 2005).

Juvenile courts waived 47% fewer delinquency cases in
2005 than in 1994, but 7% more than in 2001
Number of cases judicially waived to criminal court
14,000
12,000
10,000
8,000
6,000
4,000

The likelihood of detention varies by general offense category. In
2005, person offense cases were the most likely to involve detention (25%), followed by public order offense cases (24%). In
comparison, juveniles were less likely to be detained in drug
offense cases (18%) and property offense cases (16%).
The number of delinquency cases involving detention did not
decline when the delinquency caseload declined after 1997. In
fact, between 1997 and 2005, the number of delinquency cases in
which the juvenile was detained increased slightly (2%). The
1985–2005 growth in detained cases was about the same as the
growth in the overall delinquency caseload (48% increase in
detained cases vs. 46% increase in delinquency cases).

Intake decision
The juvenile court intake function is typically the responsibility
of the juvenile probation department or prosecutor’s office. At
intake, authorities decide whether to dismiss the case, handle
it informally (without filing a petition), or handle it formally
by filing a petition requesting an adjudicatory or waiver hearing.
In 2005, 301,200 cases (18% of all delinquency cases) were dismissed at intake, generally for lack of legal sufficiency. An additional 26% (447,400) were handled informally, with the juvenile
agreeing to some sort of voluntary sanction (e.g., restitution).
In more than half of all delinquency cases (56% or 949,300),
authorities filed a petition and the case was handled formally.
The proportion of delinquency cases petitioned for formal handling rose from 46% in 1985 to 58% in the late 1990s, and then
declined slightly to 56% in 2005.

Waiver to criminal court
In most States, juvenile court judges may waive juvenile court
jurisdiction in certain cases and transfer jurisdiction to criminal
court so the juvenile can be tried as an adult. The court decision
in these matters follows a review of the case and a determination
that there is probable cause to believe the juvenile committed the
criminal act. The judge’s decision generally centers on the issue
of whether the juvenile is amenable to treatment in the juvenile
justice system. The prosecutor may argue that the juvenile has
been adjudicated several times previously and that interventions
the juvenile court ordered have not prevented the youth from
committing subsequent criminal acts. The prosecutor may also
argue that the crime is so serious that the juvenile court cannot
intervene for the time period necessary to rehabilitate the youth.
In 2005, juvenile court judges waived jurisdiction over an estimated 6,900 delinquency cases, sending them to criminal court.
This represents less than 0.5% of all delinquency cases handled.
The number of cases waived was relatively flat from 1985 to

2,000
0
1985 1987 1989 1991 1993 1995 1997 1999 2001 2003 2005

1988, rose sharply from 1988 to 1994 (93%), then fell back to
the levels of the mid-1980s and remained there through 2005.
For many years, property offense cases accounted for the largest
proportion of waived cases. However, since the mid-1990s, person offenses have outnumbered property offenses among waived
cases. In 2005, half of waived cases involved person offenses.
Offense profile of cases waived to criminal court:
Number of
Percent of
waived cases
waived cases
Most serious offense
1985
2005
1985
2005
Total delinquency
7,200
6,900
100%
100%
Person
2,400
3,500
33
51
Property
3,800
1,900
53
27
Drugs
400
800
5
12
Public order
600
700
9
10

Adjudication and disposition
Adjudicatory hearings establish responsibility for an alleged
delinquent act. When a juvenile is adjudicated (judged) delinquent, it is analogous to conviction in criminal court. The court
holds disposition hearings to decide what sanctions should be
imposed on a juvenile who has been adjudicated delinquent and
whether the juvenile should be placed under court supervision. In
2005, juveniles were adjudicated delinquent in 66% (623,900) of
petitioned cases, an 85% increase from 1985. Once a juvenile is
adjudicated, the court makes a disposition decision. Many cases
result in multifaceted dispositions, and most involve some type
of probation supervision. A probation order often includes additional requirements, such as drug counseling, restitution to the
victim, or community service. In 2005, formal probation was the
most severe disposition ordered in 60% of cases in which the
juvenile was adjudicated delinquent, and 22% of cases were
ordered to residential placement as the most severe disposition. A
smaller proportion of cases received some other sanction as their
most severe disposition. The proportion of adjudicated cases
ordered to probation has fluctuated within a relatively narrow
range over the years (55%–61% during the 1985–2005 time period). In comparison, the proportion of cases resulting in residential placement dropped from 32% in 1985 to 22% in 2005 and
the proportion receiving other sanctions increased from 11% to
18% during that time.
—3—

Case flow for a typical 1,000 delinquency cases in 2005
4 Waived
83 Placed
Adjudicated
367 delinquent
559 Petitioned

220 Probation
65 Other sanction
11 Probation

Not adjudicated
188 delinquent

36 Other sanction
140 Dismissed

97 Probation
441 Not petitioned

167 Other sanction
177 Dismissed

Case flow for 1,697,900 delinquency cases in 2005
Waived
6,900

1%

Adjudicated
delinquent
623,900
66%

Petitioned
949,300

Placed
140,100

22%

Probation
373,400

60%

Other sanction
110,400

18%

56%
Probation
19,100
Not adjudicated
delinquent
318,500
34%

Not petitioned
748,500
44%

Probation
164,000

22%

Other sanction
283,400

38%

Dismissed
301,200

40%

6%

Other sanction
60,900

19%

Dismissed
238,500

75%

Notes: Cases are categorized by their most severe or restrictive sanction. Detail may not add to totals because of rounding. Annual case processing
flow diagrams for 1985 through 2005 are available at www.ojjdp.ncjrs.gov/ojstatbb/court/faqs.asp.

For further information
This Fact Sheet is based on the report Juvenile Court Statistics
2005, which is available through OJJDP’s Web site (www.ojp.
usdoj.gov/ojjdp). To learn more about juvenile court cases, visit
OJJDP’s online Statistical Briefing Book (www.ojjdp.ncjrs.gov/
ojstatbb/index.html) and click on “Juveniles in Court.” OJJDP
also supports Easy Access to Juvenile Court Statistics, a Webbased application that analyzes the data files used for the Juvenile Court Statistics report. This application is available from the
“Data Analysis Tools” section of the Statistical Briefing Book.

Fact Sheet

Melissa Sickmund, Ph.D., Chief of Systems Research with the National
Center for Juvenile Justice, prepared this document as a product of the
National Juvenile Court Data Archive, which is supported by OJJDP
grants 2007–JL–FX–0007 and 2007–JL–FX–0022.
The Office of Juvenile Justice and Delinquency Prevention is a component
of the Office of Justice Programs, which also includes the Bureau of Justice
Assistance; the Bureau of Justice Statistics; the Community Capacity
Development Office; the National Institute of Justice; the Office for Victims
of Crime; and the Office of Sex Offender Sentencing, Monitoring,
Apprehending, Registering, and Tracking (SMART).

NCJ 224538